This project is about a profiling tools with bytecode instrumentation. With bytecode instrumentation you can alter the content of a JAR/WAR file by modifying the loaded class files in the JVM.
Measure the memory and CPU usage of running Java web application
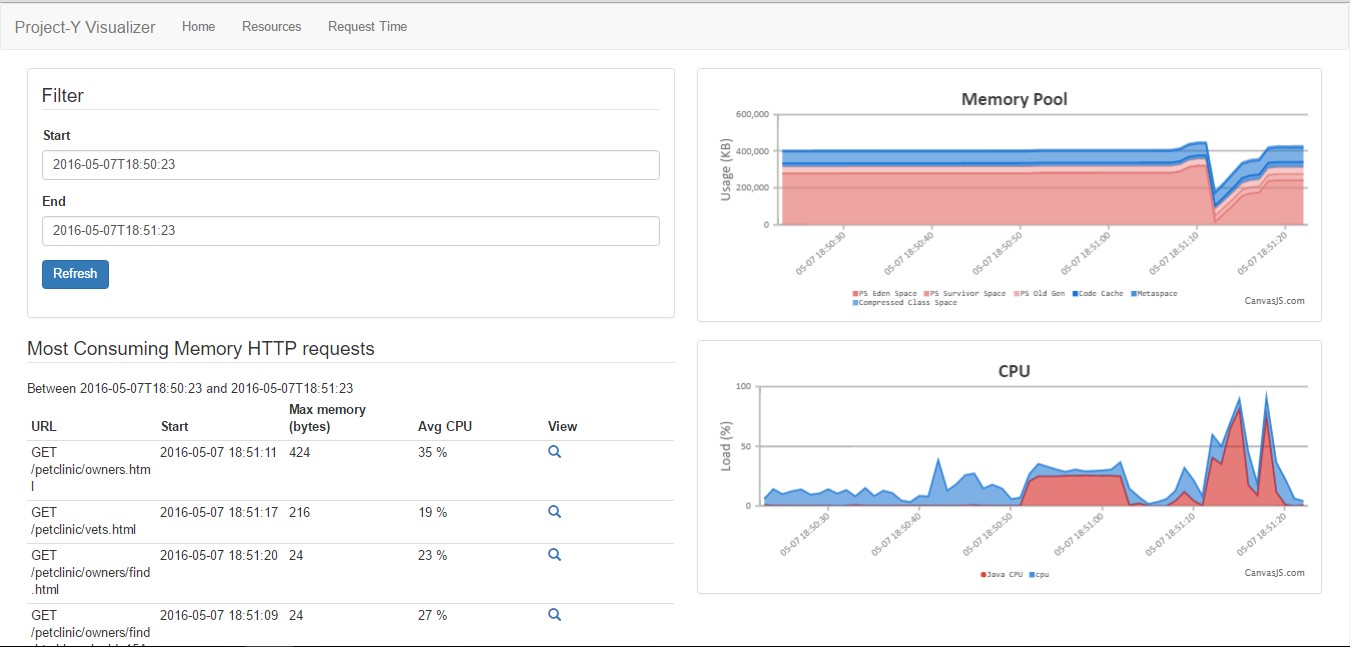
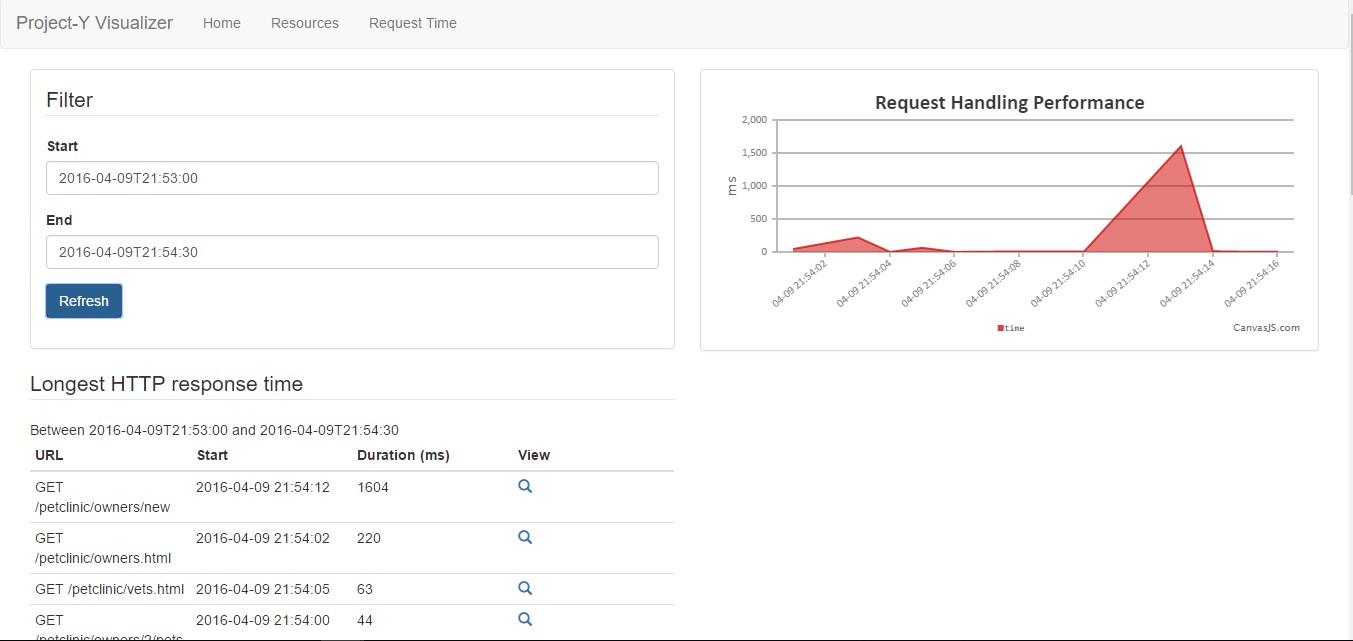
Measure the response time of HTTP request
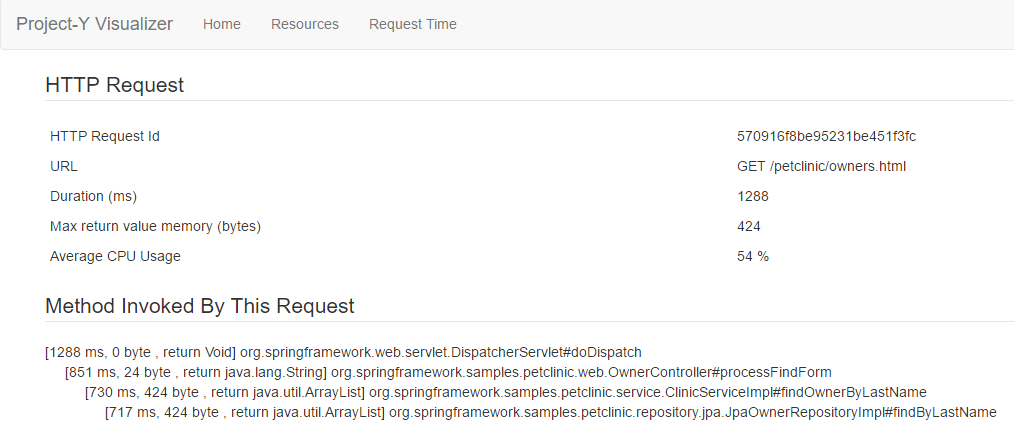
Know the execution time and object size returned from a method
To clean all projects, use gradle clean. To build all projects, use gradle build.
To build a specific module, use gradle :module_name:build. For example gradle :agent:build, or gradle :collector:build.
The profiling tools contains five modules:
agent- Used for modification of bytecode.collector- Used for receiving data from profiling result.commons- Commonly used module. Currently it only contains configuration parser.db- Used for saving data into database (use mongodb)visualizer- Used for visualizing the data
- First setup - Instrumenting a JAR
- Running the hardware monitoring thread
- Send the data to collector
- TODO - Instrumenting a web application with Tomcat Servlet Container
- TODO - Visualize the result with visualizer
Thanks to Riza Satria Perdana, S.T., M.T. and Yudistira Dwi Wardhana Asnar, S.T. Ph.D as my supervisor of thesis project