We can help you get Chronicle up and running in your organisation, we suggest you invite us in for consultancy, charged on an ad-hoc basis, we can discuss the best options tailored to your individual requirements. - email: sales@chronicle.software[Contact Us]
Or you may already be using Chronicle and just want some help - find out more..
Chronicle Queue is a distributed unbounded persisted queue.
It supports asynchronous RMI and Publish/Subscribe interfaces with micro-second latencies. In optimised examples, a message can be passed between JVMs in under a micro-second, and passed between JVMs on different machines via replication in under 10 micro-seconds. Chronicle Queue provides stable, soft, real time latencies into the millions of messages per second for a single thread to one queue with total ordering of every event.

When publishing 40 byte messages, a high percentage of the time we achieve latencies under 1 micro-second. The 99th percentile latency is the worst 1 in 100, and the 99.9th percentile is the worst 1 in 1000 latency.
| Batch Size | 10 million events per minute | 60 million events per minute | 100 million events per minute |
|---|---|---|---|
99%ile |
0.78 µs |
0.78 µs |
1.2 µs |
99.9%ile |
1.2 µs |
1.3 µs |
1.5 µs |
| Batch Size | 10 million events per minute | 60 million events per minute | 100 million events per minute |
|---|---|---|---|
99%ile |
20 µs |
28 µs |
176 µs |
99.9%ile |
901 µs |
705 µs |
5,370 µs |
|
Note
|
100 million events per minute is sending an event every 660 nano-seconds, replicated and persisted. |
|
Important
|
This is not using a large cluster of machines, this is using one thread to publish and one thread to consume. |
Releases are available on maven central as
<dependency>
  <groupId>net.openhft</groupId>
  <artifactId>chronicle-queue</artifactId>
  <version><!--replace with the latest version, see below--></version>
</dependency>
Click here to get the Latest Version Number
Snapshots are available on OSS sonatype
Chronicle Queue is a Java project focused on building a persisted low latency messaging framework for high performance and critical applications.

At first glance Chronicle Queue can be seen as yet another queue implementation but it has major design choices that should be emphasised.
Using non-heap storage options (RandomAccessFile) Queue provides a processing environment where applications do not suffer from Garbage Collection. While implementing high performance and memory-intensive applications (you heard the fancy term "bigdata"?) in Java; one of the biggest problems is Garbage Collection.
Garbage Collection (GC) may slow down your critical operations non-deterministically at any time. In order to avoid non-determinism and escape from GC delays, off-heap memory solutions are ideal. The main idea is to manage your memory manually so it does not suffer from GC. Chronicle behaves like a management interface over off-heap memory so you can build your own solutions over it.
Queue uses RandomAccessFiles while managing memory and this choice brings lots of possibilities. RandomAccessFiles permit non-sequential, or random, access to a file’s contents. To access a file randomly, you open the file, seek a particular location, and read from or write to that file. RandomAccessFiles can be seen as "large" C-type byte arrays that you can access at any random index "directly" using pointers. File portions can be used as ByteBuffers if the portion is mapped into memory.
This memory mapped file is also used for exceptionally fast interprocess communication (IPC) without affecting your system performance. There is no Garbage Collection (GC) as everything is done off heap.

-
Messages are grouped by topics. A topic can contain any number of sub-topics which are logically stored together under the queue/topic.
-
An appender is the source of messages.
-
A tailer is a receiver of messages.
-
Chronicle Queue is broker-less by default. You can use Chronicle Engine to act as a broker for remote access.
|
Note
|
We deliberately avoid the term consumer as messages are not consumed/destroyed by reading. |
At a high level, appenders write to the end of a queue. There is no way to insert or delete excerpts. Tailers read the next available message each time they are called.
By using Chronicle Engine, a Java or C# client can publish to a queue to act as a remote appender, and you subscribe to a queue to act as a remote tailer
Each topic is a directory of queues. There is a file for each roll cycle. If you have a topic called mytopic the layout could look like this
mytopic/
    20160710.cq4
    20160711.cq4
    20160712.cq4
    20160713.cq4
To copy all the data for a single day (or cycle) you can copy the file for that day on to your development machine for replay testing.
You can add a StoreFileListener to notify you when a file is added or no longer used. This can be used to delete files after a period of time, however, files are retained forever by default. Our biggest users have over 100 TB of data stored in queues.
The only thing each tailer retains is an index which is composed from a cycle number e.g. days since epoch, and a sequence number within that cycle.
In the case of a DAILY cycle, the sequence number is 32 bit and the index = ((long) cycle << 32) | sequenceNumber. Printing the index in hexadecimal is common in our libraries to make it easier to see these two components.
Appenders and tailers are cheap as they don’t even require a TCP connection. They are just a few Java objects.
Rather than partition the queue files across servers, we support each server, storing as much data as you have disk space. This is much more scalable than being limited to the amount of memory space you have. You can buy a redundant pair of 6 TB of enterprise disks for $700 (retail) at the time of (July 2016) and that is much cheaper than 6 TB of memory.
Topics are limited to being strings which can be used as directory names. Within a topic you can have sub-topics which can be any data type that can be serialized. Messages can be any serializable data.
Chronicle Queue supports:
-
Serializableobjects, though this is to be avoided as it is not efficient -
Externalizableobjects is preferred if you wish to use standard Java APIs. -
byte[] and String
-
Marshallable; a self describing message which can be written as YAML, Binary YAML or JSON. -
BytesMarshallablewhich is low level binary or text encoding.
An abstraction can be added to filter messages or assign messages to just one message processor. However, in general you only need one main tailer for a topic and possibly some supporting tailers for monitoring etc.
As Chronicle Queue doesn’t partition it’s topics, you get total ordering of all messages within that topic. Across topics there is no guarantee of ordering, and if you want to replay deterministically from a system which consumes from multiple topics, we suggest replaying from that system’s output.
It is common practice to replay a state machine from it’s inputs. To do this, there is two assumptions you have to make which are difficult to implement;
-
you have either one input, or you can always determine the order the inputs were consumed,
-
you have not changed the software (or all the software is stored in the queue).
If you want to be able to upgrade your system, then you’ll want to replay from the output.
Replaying from the output means;
-
you have a record of the order of the inputs you processed,
-
you have a record of all the decisions your new system is committed to, even if the new code would have made different decisions.
Chronicle Queue provides the following guarantees;
-
for each appender, messages are written in the order the appender wrote them. Messages by different appenders are interleaved,
-
for each tailer, it will see every message for a topic in the same order as every other tailer,
-
when replicated, every replica has a copy of every message.
Replication has three modes of operation;
-
replicates as soon as possible (< 1ms in as many as 99.9% of cases),
-
a tailer will only see messages which have been replicated,
-
an appender doesn’t return until a replica has acknowledged it has been received.
Chronicle Queue is most often used for "Producer Centric" systems where you need to retain a lot of data for days or years.
Most messaging systems are "Consumer Centric". Flow control is implemented to avoid the consumer ever getting overloaded, even momentarily.
A common example is a server supporting multiple GUI users. Those users might be on different machines (OS and hardware), different qualities of network (latency and bandwidth), doing a variety of other things at different times. For this reason it makes sense for the client consumer to tell the producer when to back off, delaying any data until the consumer is ready to take more data.
Chronicle Queue is a "Producer Centric" solution and does everything possible to never push back on the producer or tell it to slow down. This makes it a powerful tool, providing a big buffer between your system and an upstream producer you have little or no control over.
Market data publishers don’t give you the option to push back on the producer for long, if at all. A few of our users consume data from CME OPRA. This produces peaks of 10 million events per second, sent as UDP packets without any retry. If you miss or drop a packet, then it is lost. You have to consume and record those packets as fast as they come to you, with very little buffering in the network adapter.
For market data in particular, real time means in a few micro-seconds, it doesn’t mean intra-day (during the day).
Chronicle Queue is fast and efficient enough, and has been used to increase the speed that data is passed between threads. In addition, it also keeps a record of every message passed allowing you to significantly reduce the amount of logging you need to do.
Compliance Systems are required by more and more systems these days. Everyone has to have them but no one wants to be slowed down by them. By using Chronicle Queue to buffer data between monitored systems and the compliance system, you don’t need to worry about the impact of compliance recording for your monitored systems.
Again, Chronicle Queue can support millions of events per second per server and access data which has been retained for years.
Chronicle Queue supports low latency IPC (Inter Process Communication) between JVMs on the same machine ~ 1 micro-second, as well as between machines with a typical latency of 10 micro-seconds for modest throughputs of a few hundred thousands. Chronicle Queue supports throughputs over millions of events per second with stable micro-second latencies.
Chronicle Queue can be monitored to obtain latency, throughput and activity metrics in real time (within micro-seconds of the event triggering it).
As Chronicle Queue can be used to build state machines, all the information about the state of those components can be reproduced externally without direct access to the components or their state. This significantly reduces the need for additional logging.
However, any logging you do need can be recorded in great detail. This makes enabling DEBUG logging in production practical, as the cost of logging is very low in the single digit micro-seconds. Logs can be replicated centrally for log consolidation.
Chronicle Queue is being used to store 100+ TB of data which can be replayed from any point in time.
Non batching streaming components are highly performant, deterministic and reproducible. You can reproduce bugs which only show up after a million events played in a particular order, with accelerated realistic timings.
This makes using Stream Processing attractive for systems which need a high degree of quality outcomes.
Chronicle Queue is designed to be driven from code. You can easily add an interface which suits your needs.
In Chronicle-Queue we refer to the act of writing your data to the chronicle as storing an excerpt. This data could be made up from anything ranging from text, numbers or a serialised blob. Ultimately all your data regardless of what it is, is stored as a series of bytes. Just before storing your excerpt to chronicle queue, chronicle queue reserves an 8 byte header. Into this header chronicle-queue will write the length of your data. This way, when chronicle-queue comes to read your excerpt it knows how long each blob of data is. We refer to this 8 byte header along with your excerpt as a document. So strictly speaking Chronicle-Queue can be used to read and write documents. Within this 8 byte header we also reserve a few bits that are used for a number of internal operations, such as locking to make chronicle-queue thread safe across both processors and threads. The important thing to note is because of this you can’t strictly convert the 8 bytes to an integer to find the length of your data blob.
To write data to a Chronicle-Queue, you must first create an Appender
try (ChronicleQueue queue = SingleChronicleQueueBuilder.binary(path + "/trades").build()) {
   final ExcerptAppender appender = queue.acquireAppender();
}
So, Chronicle-Queue uses an Appender to write to the queue and a Tailer to read from the queue. Unlike other java queuing solutions, messages are not lost when they are read with a Tailer, This is covered in more detail in the section below on "Reading from a Queue"
Chronicle-Queue uses the following low level interface to write the data
try (final DocumentContext dc = appender.writingDocument()) {

      dc.wire().write().text(“your text data“);
}
the close on the try-with-resources, is the point at when the length of the data is written to the header. You can also use the DocumentContext to find out the index that your data has just been assigned ( see below ) you can later use this index to move-to/look up this excerpt. Each chronicle-queue excerpt has a unique index.
try (final DocumentContext dc = appender.writingDocument()) {
    dc.wire().write().text(“your text data“);
    System.out.println("your data was store to index="+ dc.index());
}
The high level methods below such as “writeText()” are convenience methods on calling appender.writingDocument(), but both approaches essentially do the same thing. The actual code of writeText(CharSequence text) looks like this.
/**
 * @param text to write a message
 */
void writeText(CharSequence text) {
    try (DocumentContext dc = writingDocument()) {
        dc.wire().bytes().append8bit(text);
    }
}
So you have a choice of a number of high level interfaces down to a low level API to raw memory. This is the highest level API which hides the fact you are writing to messaging at all. The benefit is; you can swap calls to the interface with a real component or an interface to a different protocol.
// using the method writer interface.
RiskMonitor riskMonitor = appender.methodWriter(RiskMonitor.class);
final LocalDateTime now = LocalDateTime.now(Clock.systemUTC());
riskMonitor.trade(new TradeDetails(now, "GBPUSD", 1.3095, 10e6, Side.Buy, "peter"));
You can write a "self describing message". Such messages can support schema changes. They are also easier to understand when debugging or diagnosing problems.
// writing a self describing message
appender.writeDocument(w -> w.write("trade").marshallable(
        m -> m.write("timestamp").dateTime(now)
                .write("symbol").text("EURUSD")
                .write("price").float64(1.1101)
                .write("quantity").float64(15e6)
                .write("side").object(Side.class, Side.Sell)
                .write("trader").text("peter")));
You can write "raw data" which is self-describing (the types will always be correct, position is the only indication as to the meaning of those values).
// writing just data
appender.writeDocument(w -> w
        .getValueOut().int32(0x123456)
        .getValueOut().int64(0x999000999000L)
        .getValueOut().text("Hello World"));
You can write "raw data" which is not self-describing. Your reader must know what this data means and the types which were used.
// writing raw data
appender.writeBytes(b -> b
        .writeByte((byte) 0x12)
        .writeInt(0x345678)
        .writeLong(0x999000999000L)
        .writeUtf8("Hello World"));
This is the lowest level way to write data. You get an address to raw memory and you can write what you want.
// Unsafe low level
appender.writeBytes(b -> {
    long address = b.address(b.writePosition());
    Unsafe unsafe = UnsafeMemory.UNSAFE;
    unsafe.putByte(address, (byte) 0x12);
    address += 1;
    unsafe.putInt(address, 0x345678);
    address += 4;
    unsafe.putLong(address, 0x999000999000L);
    address += 8;
    byte[] bytes = "Hello World".getBytes(StandardCharsets.ISO_8859_1);
    unsafe.copyMemory(bytes, Unsafe.ARRAY_BYTE_BASE_OFFSET, null, address, bytes.length);
    b.writeSkip(1 + 4 + 8 + bytes.length);
});
You can print the contents of the queue. You can see the first two and last two messages store the same data.
// dump the content of the queue
System.out.println(queue.dump());
Prints
# position: 262568, header: 0
--- !!data #binary
trade: {
  timestamp: 2016-07-17T15:18:41.141,
  symbol: GBPUSD,
  price: 1.3095,
  quantity: 10000000.0,
  side: Buy,
  trader: peter
}
# position: 262684, header: 1
--- !!data #binary
trade: {
  timestamp: 2016-07-17T15:18:41.141,
  symbol: EURUSD,
  price: 1.1101,
  quantity: 15000000.0,
  side: Sell,
  trader: peter
}
# position: 262800, header: 2
--- !!data #binary
!int 1193046
168843764404224
Hello World
# position: 262830, header: 3
--- !!data #binary
000402b0       12 78 56 34 00 00  90 99 00 90 99 00 00 0B   ·xV4·· ········
000402c0 48 65 6C 6C 6F 20 57 6F  72 6C 64                Hello Wo rld
# position: 262859, header: 4
--- !!data #binary
000402c0                                               12                 ·
000402d0 78 56 34 00 00 90 99 00  90 99 00 00 0B 48 65 6C xV4····· ·····Hel
000402e0 6C 6F 20 57 6F 72 6C 64 lo WorldChronicle Queue stores its data in binary format, with a file extension of 'cq4' :
\��@π�header∂�SCQStoreÇE���»wireType∂�WireTypeÊBINARYÕwritePositionèèèèß��������ƒroll∂�SCQSRollÇ*���∆length¶ÄÓ6�∆format
ÎyyyyMMdd-HH≈epoch¶ÄÓ6�»indexing∂SCQSIndexingÇN��� indexCount•��ÃindexSpacing�Àindex2Indexé����ß��������…lastIndexé�
���ß��������fllastAcknowledgedIndexReplicatedé������ߡˇˇˇˇˇˇˇ»recovery∂�TimedStoreRecoveryÇ����…timeStampèèèß����������������������������������������������������������������������������������������������������������������������������������������������������������������������������������������������������������������������������������������������������������������������������������������������������������������������������������������������������������������������������������������������������������������������������������������������������������������������������������������������������������������������������������������������������������������������������������������������������������������������������������������������������������������������������������������������������������������������������������������������������������������������������������������������������������������������������������������������������������������������������������������������������������������������������������������������������
This can often be a bit difficult to read, So its better to dump the 'cq4' files as text , this can also help you fix your production issues, as it gives you the visibility , of what has been stored into the queue and in what order.
The example below shows how to read a 'cq4' file from the command line:
You have to use the chronicle-queue.jar, from any version 4.5.3 or later, and set up the dependent files in the class path. (to find out which version of jars to include please refer to the chronicle-bom ),
Once you have the dependent jars on the class path ( like below )
$ ls -ltr
total 9920
-rw-r--r--  1 robaustin  staff   112557 28 Jul 14:52 chronicle-queue-4.5.5.jar
-rw-r--r--  1 robaustin  staff   209268 28 Jul 14:53 chronicle-bytes-1.7.3.jar
-rw-r--r--  1 robaustin  staff   136434 28 Jul 14:56 chronicle-core-1.7.3.jar
-rw-r--r--  1 robaustin  staff    33562 28 Jul 15:03 slf4j-api-1.7.14.jar
-rw-r--r--  1 robaustin  staff   324302 28 Jul 15:04 chronicle-wire-1.7.5.jar
-rw-r--r--  1 robaustin  staff    35112 28 Jul 15:05 chronicle-threads-1.7.2.jar
-rw-r--r--  1 robaustin  staff  4198400 28 Jul 15:05 19700101-02.cq4
you can run
$ java -cp chronicle-queue-4.5.5.jar net.openhft.chronicle.queue.DumpQueueMain 19700101-02.cq4this will dump the 19700101-02.cq4 file out as text, like this :
--- !!meta-data #binary
header: !SCQStore {
  wireType: !WireType BINARY,
  writePosition: 0,
  roll: !SCQSRoll {
    length: !int 3600000,
    format: yyyyMMdd-HH,
    epoch: !int 3600000
  },
  indexing: !SCQSIndexing {
    indexCount: !short 4096,
    indexSpacing: 4,
    index2Index: 0,
    lastIndex: 0
  },
  lastAcknowledgedIndexReplicated: -1,
  recovery: !TimedStoreRecovery {
    timeStamp: 0
  }
}

...
# 4198044 bytes remaining
Note : the above example does not show any user data, because no user data was written to this example file.
Reading the queue follows the same pattern as writting, except there is a possibility there is not a message when you attempt to read it.
try (ChronicleQueue queue = SingleChronicleQueueBuilder.binary(path + "/trades").build()) {
   final ExcerptTailer tailer = queue.createTailer();
You can turn each message into a method call based on the content of the message.
// reading using method calls
RiskMonitor monitor = System.out::println;
MethodReader reader = tailer.methodReader(monitor);
// read one message
assertTrue(reader.readOne());
You can decode the message yourself.
|
Note
|
the names, type and order of the fields doesn’t have to match. |
assertTrue(tailer.readDocument(w -> w.read("trade").marshallable(
        m -> {
            LocalDateTime timestamp = m.read("timestamp").dateTime();
            String symbol = m.read("symbol").text();
            double price = m.read("price").float64();
            double quantity = m.read("quantity").float64();
            Side side = m.read("side").object(Side.class);
            String trader = m.read("trader").text();
            // do something with values.
        })));
You can read self-describing data values. This will check the types are right and convert as required.
assertTrue(tailer.readDocument(w -> {
    ValueIn in = w.getValueIn();
    int num = in.int32();
    long num2 = in.int64();
    String text = in.text();
    // do something with values
}));
You can read raw data as primitives and Strings.
assertTrue(tailer.readBytes(in -> {
    int code = in.readByte();
    int num = in.readInt();
    long num2 = in.readLong();
    String text = in.readUtf8();
    assertEquals("Hello World", text);
    // do something with values
}));
Or you can get the underlying memory address and access the native memory.
assertTrue(tailer.readBytes(b -> {
    long address = b.address(b.readPosition());
    Unsafe unsafe = UnsafeMemory.UNSAFE;
    int code = unsafe.getByte(address);
    address++;
    int num = unsafe.getInt(address);
    address += 4;
    long num2 = unsafe.getLong(address);
    address += 8;
    int length = unsafe.getByte(address);
    address++;
    byte[] bytes = new byte[length];
    unsafe.copyMemory(null, address, bytes, Unsafe.ARRAY_BYTE_BASE_OFFSET, bytes.length);
    String text = new String(bytes, StandardCharsets.UTF_8);
    assertEquals("Hello World", text);
    // do something with values
}));Chronicle v4.4+ supports the use of proxies to send and consume messages. You start by defining an asynchronous interface, where all methods have;
-
arguments which are only inputs,
-
no return value or exceptions expected.
interface MessageListener {
    void method1(Message1 message);

    void method2(Message2 message);
}

static class Message1 extends AbstractMarshallable {
    String text;

    public Message1(String text) {
        this.text = text;
    }
}

static class Message2 extends AbstractMarshallable {
    long number;

    public Message2(long number) {
        this.number = number;
    }
}
To write to the queue you can call a proxy which implements this interface.
SingleChronicleQueue queue1 = SingleChronicleQueueBuilder.binary(path).build();

MessageListener writer1 = queue1.acquireAppender().methodWriter(MessageListener.class);

// call method on the interface to send messages
writer1.method1(new Message1("hello"));
writer1.method2(new Message2(234));
These call produce message which can be dumped as follows.
# position: 262568, header: 0
--- !!data #binary
method1: {
  text: hello
}
# position: 262597, header: 1
--- !!data #binary
method2: {
  number: !int 234
}
To read the messages, you can provide a reader which calls your implementation with the same calls you made.
// a proxy which print each method called on it
MessageListener processor = ObjectUtils.printAll(MessageListener.class)
// a queue reader which turns messages into method calls.
MethodReader reader2 = queue1.createTailer().methodReader(processor);

assertTrue(reader1.readOne());
assertTrue(reader1.readOne());
assertFalse(reader1.readOne());
Running this example prints:
method1 [!Message1 {
  text: hello
}
]
method2 [!Message2 {
  number: 234
}
]-
For more details Using Method Reader/Writers and MessageReaderWriterTest
Chronicle Queue is the main interface for management and can be seen as the Collection class of Chronicle environment. You will reserve a portion of memory and then put/fetch/update records using the Chronicle interface.
Chronicle has three main concepts:
-
Tailer (sequential and random reads, forward and backwards)
-
Appender (sequential writes, append to the end only).
An Excerpt is the main data container in a Chronicle Queue, each Chronicle is composed of Excerpts. Putting data to a chronicle means starting a new Excerpt, writing data into it and finishing the Excerpt at the end. A Tailer is an Excerpt optimized for sequential reads. An Appender is something like Iterator in Chronicle environment. You add data appending the current chronicle.
Queue v4 (Q4) attempts to solve a number of issues that existed in Queue v3 (Q3).
-
Without self-describing messages, users had to create their own functionality for dumping messages and long term storage of data. With Q4 you don’t have to do this, but you can if you wish to.
-
Vanilla Chronicle Queue would create a file per thread. This is fine if the number of threads is controlled, however, many applications have little or no control over how many threads are used and this caused usability problems.
-
The configuration for Indexed and Vanilla Chronicle was entirely in code so the reader had to have the same configuration as the writers and it wasn’t always clear what that was.
-
There was no way for the producer to know how much data had been replicated to the a second machine. The only work around was to replicate data back to the producers.
-
You needed to specify the size of data to reserve before you started to write your message.
-
You needed to do your own locking for the appender when using Indexed Chronicle.
Yes. They use different packages. Queue v4 is a complete re-write so there is no problem using it at the same time as v3. But the format of how the data is stored is slightly different, so they are are not interoperable on the same queue data file.
In Queue v3, everything was in terms of Bytes, not wire. There is two ways to use byte in Queue v4. You can use the writeBytes and readBytes methods, or you can get the bytes() from the wire e.g.
appender.writeBytes(b -> b.writeInt(1234).writeDouble(1.111));

boolean present = tailer.readBytes(b -> process(b.readInt(), b.readDouble()));try (DocumentContext dc = appender.writingDocument()) {
Bytes bytes = dc.wire().bytes();
// write to bytes
}
try (DocumentContext dc = tailer.readingDocument()) {
if (dc.isPresent()) {
Bytes bytes = dc.wire().bytes();
// read from bytes
}
}This queue is a designed to support: - rolling files on a daily, weekly or hourly basis, - concurrent writers on the same machine, - concurrent readers on the same machine or across multiple machines via TCP replication (With Chronicle Queue Enterprise), - zero copy serialization and deserialization, - millions of writes/reads per second on commodity hardware. <br/>(~5 M messages / second for 96 byte messages on a i7-4790).
The directory structure is as follows:
base-directory /
   {cycle-name}.cq4       - The default format is yyyyMMdd for daily rolling.
The format consists of Size Prefixed Bytes which are formatted using BinaryWire or TextWire. The ChronicleQueue.dump() method can be used to dump the raw contents as a String.
Creating an instance of Chronicle is a little more complex than just calling a constructor. To create an instance you have to use the ChronicleQueueBuilder.
String basePath = System.getProperty("java.io.tmpdir") + "/getting-started"
ChronicleQueue queue = ChronicleQueueBuilder.single("queue-dir").build();
In this example we have created an IndexedChronicle which creates two RandomAccessFiles; one for indexes and one for data having names relatively:
${java.io.tmpdir}/getting-started/{today}.cq4
// Obtain an ExcerptAppender
ExcerptAppender appender = queue.acquireAppender();

// write - {msg: TestMessage}
appender.writeDocument(w -> w.write(() -> "msg").text("TestMessage"));

// write - TestMessage
appender.writeText("TestMessage");ExcerptTailer tailer = queue.createTailer();
tailer.readDocument(w -> System.out.println("msg: " + w.read(()->"msg").text()));
assertEquals("TestMessage", tailer.readText());Chronicle Queue stores its data off heap, and it is recommended that you call close()
once you have finished working with Chronicle-Queue to free resources,
|
Note
|
no data will be lost if you don’t do this, this is only to clean resources used. |
queue.close();try (ChronicleQueue queue = ChronicleQueueBuilder.single("queue-dir").build()) {
// Obtain an ExcerptAppender
ExcerptAppender appender = queue.acquireAppender();
// write - {msg: TestMessage}
appender.writeDocument(w -> w.write(() -> "msg").text("TestMessage"));
// write - TestMessage
appender.writeText("TestMessage");
ExcerptTailer tailer = queue.createTailer();

tailer.readDocument(w -> System.out.println("msg: " + w.read(()->"msg").text()));

assertEquals("TestMessage", tailer.readText());
}Caused by: java.lang.OutOfMemoryError: Map failed
at sun.nio.ch.FileChannelImpl.map0(Native Method)
at sun.reflect.NativeMethodAccessorImpl.invoke0(Native Method)
at sun.reflect.NativeMethodAccessorImpl.invoke(NativeMethodAccessorImpl.java:62)
at sun.reflect.DelegatingMethodAccessorImpl.invoke(DelegatingMethodAccessorImpl.java:43)
at java.lang.reflect.Method.invoke(Method.java:497)
at net.openhft.chronicle.core.OS.map0(OS.java:292)
at net.openhft.chronicle.core.OS.map(OS.java:280)
... 54 moreThe problem is that it’s running out of virtual memory, you are more likley to see this if you are running a 32Bit Jvm on 64bit. One work around is to use a 64bit Jvm.
The time chronicle-queue rolls, is based on the UTC time, it uses System.currentTimeMillis().
When using daily rolling chronicle queue will roll at midnight UTC. If you wish to change the time it rolls, you have to change chronicle-queue’s epoch() time. This time is a milli seconds offset, in other words, if you set the epoch to be epoch(1) then chronicle will roll at 1ms passed midnight.
Path path = Files.createTempDirectory("rollCycleTest");
SingleChronicleQueue queue = SingleChronicleQueueBuilder.binary(path).epoch(0).build();
We don't recommend you change the epoch() on an existing system, which already has .cq4 files create, using a diffrent epoch().
If you were to set :
[source, Java]
----
.epoch(System.currentTimeMillis()
----
This would make the current time the roll time, and the cycle numbers would start from ZERO.
WireStore wireStore = queue.storeForCycle(queue.cycle(), 0, false);
System.out.println(wireStore.file().getAbsolutePath());You can access the Bytes in wire as follows:
try (DocumentContext dc = appender.writingDocument()) {
    Wire wire = dc.wire();
    Bytes bytes = wire.bytes();
    // write to bytes
}try (DocumentContext dc = tailer.readingDocument()) {
Wire wire = dc.wire();
Bytes bytes = wire.bytes();
// read from the bytes
}you can use isPresent() to check that there is data to read
try (DocumentContext dc = tailer.readingDocument()) {
    if(!dc.isPresent()) // this will tell you if there is any data  to read
        return;
    Bytes bytes = wire.bytes();
    // read from the bytes
}You can access native memory:
try (DocumentContext dc = appender.writingDocument()) {
    Wire wire = dc.wire();
    Bytes bytes = wire.bytes();
    long address = bytes.address(bytes.readPosition());
    // write to native memory
    bytes.writeSkip(lengthActuallyWritten);
}try (DocumentContext dc = appender.writingDocument()) {
Wire wire = dc.wire();
Bytes bytes = wire.bytes();
long address = bytes.address(bytes.readPosition());
long length = bytes.readRemaining();
// read from native memory
}The writingDocument() should be performed as quickly as possible because a write lock is held until the DocumentContext is closed by the try-with-resources, this blocks other appenders and tailers.
try (DocumentContext dc = appender.writingDocument()) {
  // this should be performed as quickly as possible because a write lock is held until the
  // DocumentContext is closed by the try-with-resources,  this blocks other appenders and tailers.
}You should try to avoid abruptly killing chronicle queue, especially if its in the middle of writing a message
try (DocumentContext dc = appender.writingDocument()) {
    // killing chronicle queue here will leave the file in a locked state
 }
if you kill chronicle queue when its half way through writing a document, this can leave your chronicle-queue in a locked state, which could later prevent other appenders from writing to the queue file. Although, we don’t recommend that you "$kill -9" your process, luckily in the event that your process abruptly terminates, we have added recovery code that should recover from this situation.
Chronicle Queue is designed to be a "record everything store" which can read with micro-second real time latency. This supports even the most demanding High Frequency Trading systems, however it can be used in any application where the recording of information is a concern.
Chronicle Queue Enterprise is designed to support reliable replication with notification to either the appender or a tailer when a message has been successfully replicated.
Chronicle Queue assumes disk space is cheap (compared with memory). Enterprise SSD costs have come down. One GB of disk space is worth less than 1 minute of your time on minimum wage (in the UK at time of writing; July 2016). Queue makes full use of the disk space you have, and so you are not limited by the main memory of your machine. If you use spinning HDD, you can store many TB of disk space for little cost.
The only piece of software Chronicle Queue needs to run is the Operating System. It doesn’t have a broker, instead it uses your Operating System to do all the work. If your application dies, the OS keeps running for seconds longer, so no data is lost, even without replication.
As Chronicle Queue stores all saved data in memory mapped files, this has a trivial on heap overhead, even if you have over 100 TB of data.
We put significant effort into worrying about latency you can’t see. Unlike products which focus on support of the web, we care about latency which are a fraction of the time you can see. Less than 40 ms is fine for web applications as it’s faster than you can see (the frame rate of cinema is 24 Hz or about 40 ms). However, we attempt to be under 40 microsecond 99% to 99.99% of the time. Using queue without replication, we support applications with latencies below 40 microseconds end to end across multiple services. Often the 99% latency of queue is entirely dependant on the choice of OS and disk subsystem.
Replication for Chronicle Queue supports Chronicle Wire Enterprise. This supports a real time compression which calculates the deltas for individual objects as they are written. This can reduce the size of messages to 1/10th, or better, without the need for batching i.e without introducing significant latency.
Queue also supports LZW, Snappy and GZIP compression however, these add non-trivial latency. These are only useful if you have to have strict limitations on network bandwidth.
Chronicle Queue supports a number of semantics.
-
Every message is replayed on restart.
-
Only new messages are played on restart.
-
Restart from any known point using the index of the entry.
-
Replay only the messages you have missed. This is supported directly using the methodReader/methodWriter builders.
Chronicle Queue supports explicit or implicit nano-second resolution timing for messages as they pass end to end over across your system. We support using nanotime across machines, without the need for specialist hardware.
SidedMarketDataListener combiner = out.acquireAppender()
        .methodWriterBuilder(SidedMarketDataListener.class)
        .recordHistory(true)
        .get();

combiner.onSidedPrice(new SidedPrice("EURUSD1", 123456789000L, Side.Sell, 1.1172, 2e6));
A timestamp is added for each read and write as it passes from service to service.
--- !!data #binary
history: {
  sources: [
    1,
    0x426700000000 # (4)
  ]
  timings: [
    1394278797664704, # (1)
    1394278822632044, # (2)
    1394278824073475  # (3)
  ]
}
onTopOfBookPrice: {
  symbol: EURUSD1,
  timestamp: 123456789000,
  buyPrice: NaN,
  buyQuantity: 0,
  sellPrice: 1.1172,
  sellQuantity: 2000000.0
}-
First write
-
First read
-
Write of the result of the read.
-
What triggered this event.
On most systems System.nanoTime() is roughly the number of nano-seconds since the system last rebooted (although different JVMs may behave differently). This is the same across JVM on the same machine, but wildly different between machines. The absolute difference when it comes to machines is meaningless, however the information can be used to detect outliers. i.e. you can’t determine what the best latency is, but you can determine how far off the best latencies you are. This is useful if you are focusing on the 99th percentile latencies for example. We have a class called RunningMinimum to obtain timings from different machines while compensating for a drift in the nanoTime between machines. The more often you take measurements the more accurate this running minimum is.
Chronicle Queue is designed to support over an order of magnitude of throughput, with an order of magnitude lower than the latency of Kafka. While Kafka is faster than many of the alternatives it doesn’t support both throughputs over million of events per second, and low latency e.g. 1 - 20 micro-seconds at the same time.
Chronicle Queue attempts to handle more volume from a single thread, to a single partition. Thus avoiding the need for the complexity and the downsides of having partitions.
|
Note
|
Chronicle Engine supports partitioning of queues across machines, though not the partitioning of a queue. |
Kafka uses a broker which uses the operating system’s file system and cache. On the other hand, Chronicle Queue relies entirely on the file system and cache.
Chronicle Queue Enterprise supports TCP replication with optional filtering so only the required record or even fields are transmitted. This improves performances and reduces bandwidth requirements.

The following charts time how long it takes to:
-
Write a 40 byte message to a Chronicle Queue.
-
Have the write replicated over TCP.
-
Have the second copy acknowledge receipt of the message.
-
Have a thread read the acknowledged message.
The test is run for ten minutes and the distribution of latencies plotted.
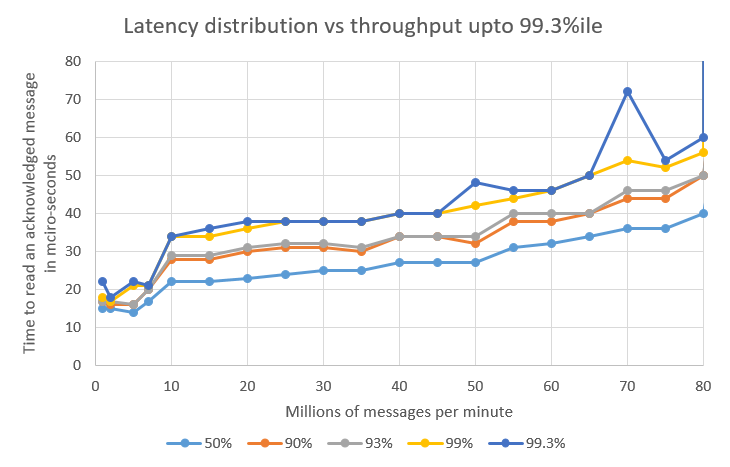
|
Note
|
There is a step in latency at around 10 million message per second jumps as the messages start to batch. At rates below this, each message can be sent individually. |
The 99.99%ile and above are believed to be delays in passing the message over TCP. Further research is needed to prove this. In any case, these delays are much the same regardless of the throughput.
The 99.9%ile and 99.93%ile are a function of how quickly the system can recover after a delay. The higher the throughput, the less head room the system has to recover form a delay.
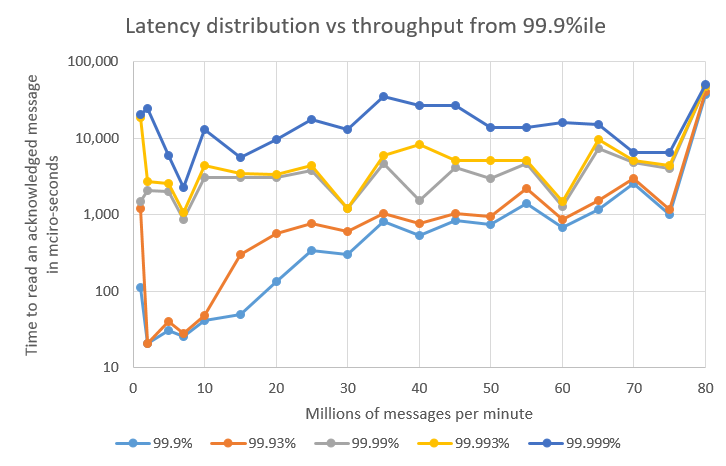
In the test above, the typical latency varied between 14 and 40 micro-seconds, the 99%ile varied between 17 and 56 micro-seconds depending on the throughput being tested. Notably, the 99.93% latency varied between 21 micro-seconds and 41 milli-seconds, a factor of 2000.
Acceptable Latency |
Throughput |
< 30 micro-seconds 99.3% of the time |
7 million message per second |
< 20 micro-seconds 99.9% of the time |
20 million messages per second |
< 1 milli-seconds 99.9% of the time |
50 million messages per second |
< 60 micro-seconds 99.3% of the time |
80 million message per second |
Not implicitly. We didn’t want to assume whether the appenders or tailers
-
were running at the same time.
-
were in the same process
-
wanted to block on the queue for either writing or reading.
If both the Appender and Tailer are in the same process, the Tailer can use a pauser when not busy
pauser = balanced ? Parser.balanced() : Pauser.millis(1, 10);
while (!closed) {
    if (reader.readOne())
        pauser.reset();
    else
        pauser.pause();
}
In another thread you can wake the reader with
pauser.unpause();